[Spring Break] Friday Mar. 25 travel
Clipper delivers wintry mix to Great Lakes, though impacts look to be modest
Welcome to any new readers—we're grateful that you're here! We're building deep learning algorithms to democratize flight delay predictions; until we launch, we're eager to synthesize things manually in our outlooks. These feature several recurring themes that we recognize may be unfamiliar or intimidating, so we’ve written explainers that tackle airport arrival rates, queuing delays in the airspace and different tools to distribute those delays. If there’s a topic or mechanism you’d like to see unpacked, please let us know (same goes for special travel occasions).
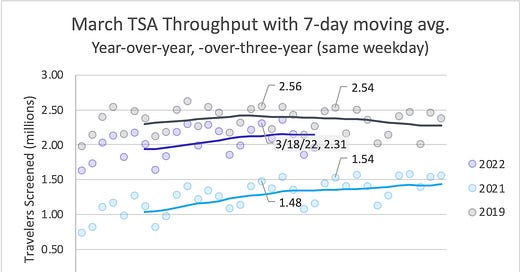
While falling short of Thanksgiving’s high-water mark, TSA checkpoint volumes were nonetheless impressive last weekend. 2.31 million travelers were screened on Friday, which was briefly good for third most since demand bottomed out in April 2020. Friday would quickly be bumped out of the top three by Sunday, which came at 2.37 million and currently stands at second most. That said, there’s some signs of slowing traffic, with week-over-week TSA throughput having declined the last three days. Demand pulling back at this point in March isn’t necessarily cause for alarm—it could indicate a return to more “normal,” pre-COVID patterns. In 2019, the 7-day moving average peaked at the equivalent of last Thursday; last year, the 7-day moving average climbed almost1 uninterrupted through March.
What does that mean for travel volumes tomorrow? If the remainder of this month more closely aligns itself with the shape of March 2019, we could expect checkpoint numbers to tick down week-over-week (to around 2.29 million screened). If the last three days were just a blip and our 7-day moving average bends upwards again—in line with last year—then 2.40 million is a reasonable expectation. For its part, our Holt-Winters forecast remains a bit skeptical of deceleration and predicts 2.39 million travelers will be screened. Some have observed that operations have strained under the weight of Spring Break loads, though month-to-date on-time arrivals are off just 5 percentage points from March 2019 levels2. Reliability is perhaps sagging, but not crumbling, in our view. Generally favorable weather3 has helped to buoy operational outcomes so far this month: for travelers on Friday, this trend fortunately looks to continue.
The Great Lakes
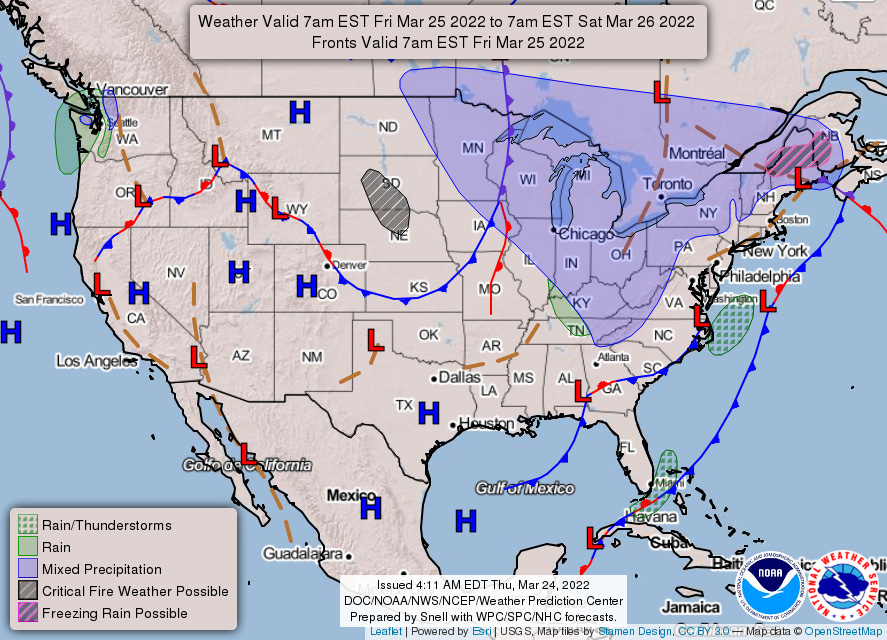
A clipper system moving out of central Canada will be the focal feature in Friday’s weather story, however associated precipitation should be generally light. While initially warm enough to produce rain at Minneapolis-St. Paul (MSP), the system draws cold air into the area and a changeover to snow showers is expected by afternoon. MSP, arguably the most adept winter operations airport, should easily handle whatever accumulates (The Weather Prediction Center indicates probabilities are no more than 1 in 20 for accumulations to reach 1”), though winds may end up garnering headlines, with gusts to 40 knots possible. The forecast discussion from the Twin Cities weather service office also expresses some concern about snow squalls4, however the threat looks to be more substantial for western Wisconsin.
We think 54 is a good arrival rate floor (less than 1 in 20 chance for lower rates), albeit not unlikely to occur itself (1 in 6). Scheduled arrival demand peaks at 48 in the 2 p.m. hour, with a steep drop-off to the next tallest peak (33 flights in the 7 p.m. hour). In the absence of a scheduled demand overage, our confidence5 is high that air traffic delays will be similarly absent at MSP tomorrow. While we don’t anticipate any traffic management initiatives (e.g. ground stop, ground delay program) to delay arrivals, departure delays for deicing should be expected if snow is falling. And, of course, delays owing to aircraft servicing, airline staffing, network effects, etc. are always lurking.
Chicago-O’Hare’s (ORD) precipitation type is a bit trickier to forecast. Temperatures should be warm enough that precipitation starts as rain showers during the afternoon, but—like MSP—cold air will quickly filter in (and down). Even during the afternoon, temperatures could cool underneath the most robust showers, allowing for localized heavy snow showers. All showers should transition to snow during the evening. Additionally, freezing levels and the convective nature of precipitation favors graupel (i.e. small, soft hail) to accompany many of the showers. And finally, thunder is not out of the question. Phew!
How does that mixed bag translate to airport capacity? In addition to precipitation, we’ll also need to be mindful of gusts possibly approaching 45 knots in the strongest showers. We’d put ORD’s arrival rate floor at 88 (1 in 10 chance for equal or lower rates). Scheduled demand touches 91, 89 and 96 in the 2, 4 and 6 p.m. hours, respectively. We suspect the FAA will take a wait-and-see approach, given that the convective precipitation will be more scattered. Such an approach would leave airborne holding and a likely first tier ground stop in the toolbox if one of the stronger showers manages to find ORD (they always seem to). We’ve modeled an 86 arrival rate across the afternoon and evening, which produces delays approaching 30 minutes6 for arrivals scheduled after 5 p.m. (with the risk ending by 8 p.m.). Ultimately we don’t anticipate capacity would be reduced across the entire p.m., however just one ill-timed hour would be enough to introduce that level of delay. And similar to MSP, anytime some frozen form of precipitation is falling, deicing delays for departures should be expected.
Elsewhere
The oft-used national forecast chart suggests moisture could impact Seattle (SEA), however the national blend of model limits probabilities to 5% or less for ceilings falling below visual minimums. The forecast discussion from the local weather service office supports this, noting that weak high pressure should keep the Seattle metro area dry until after midnight ahead of the next frontal system.
In the other corner of the country, Miami (MIA) is depicted on the fringe of thunderstorm coverage, but high-resolution ensemble guidance suggests chances for thunder will have shifted eastward by 7 a.m. and MIA arrival demand doesn’t really spool up until the 9 a.m. hour. Once again, the forecast discussion from the local office corroborates this, indicating that gradual clearing occurs behind a frontal boundary sweeping through South Florida tonight.
Before we move on from Florida—and because we had comparatively few concerns to write about in this post—we wanted to highlight Palm Beach (PBI). We typically limit our focus to a group of 30 airports that the FAA considers “core,” though for this exercise we’ll expand our scope to the ASPM 777. 30.4% of PBI arrivals have been assigned a wheels up time this month, highest among ASPM 77 airport and more than double the second most delayed airport. Why? Unscheduled demand has added more than 200% on top of scheduled demand. Unfortunately, uncertainty around unscheduled demand—and therefore how total demand settles out—makes it difficult8 to speculate about the shape and intensity of air traffic delays, but we wanted to mention the potential for them. We take solace in the fact that PBI exerts relatively low leverage on itineraries, as it’s not a connecting hub: adjusting delay expectations, not rebooking, should suffice in almost all cases.
Recommendations
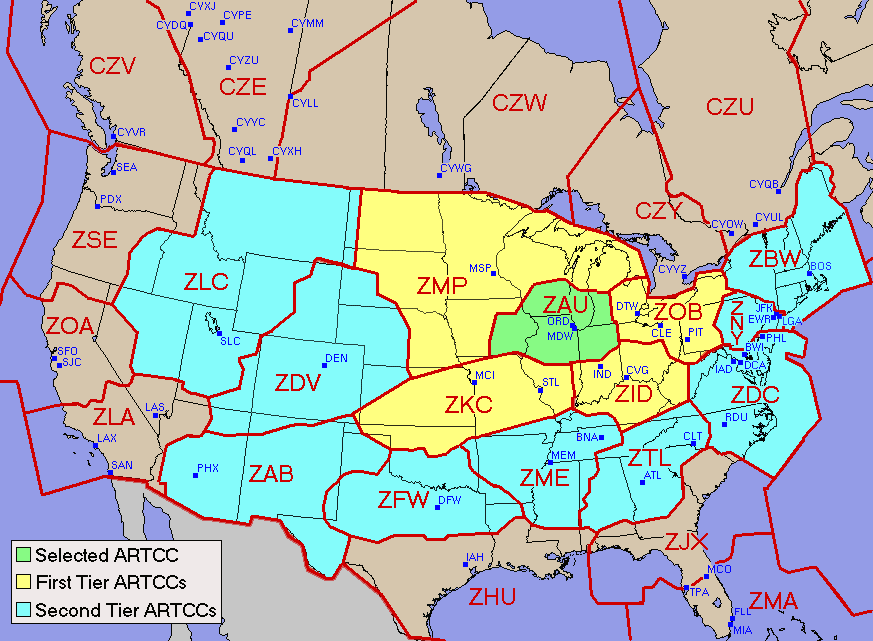
While we’ll take the opportunity to remind readers that airlines have eliminated change fees for most tickets, we don’t think there’s much need to exercise this improved flexibility tomorrow. Any recommendation to explore rebooking options would be limited to risk-averse travelers with a late afternoon/early evening layover at ORD that couldn’t absorb a delay of 30 minutes. We’d nudge probabilities for disruption downwards if the itinerary originates beyond ORD’s first tier9.
We’d given consideration to writing about Sunday travel, as Sunday has been the more heavily traveled day for 3 of the last 4 weekends (and for this equivalent upcoming weekend last year). However, Sunday weather looks even quieter than tomorrow’s forecast, leaving us too little to write about. San Francisco (SFO), which has been unscathed thus far in March, figures to be the one airport worth watching on Sunday. A low is expected to form just west of California, though there’s some differences among extended range models in terms of placement and track of this low. If the low stays closer to the coast of Northern California, rain could be introduced to the forecast as early as Sunday morning; a southward placement of the low would keep rain out of the forecast until late Sunday. While we won’t be writing about this weekend any further on Substack, we will craft a tweet-sized SFO outlook once there’s better model agreement.
It turned downwards just once in 2021: after Tuesday, March 23 (and only by 0.17%).
For ASPM 77 airports (see footnote 7) aggregated, 74.3% of flights have arrived less than 15 minutes past the scheduled time month-to-date (through 3/23/22). In March 2019, 79.4% of flights arrived less than 15 minutes past the scheduled time. Source: FAA ASPM Airport Analysis module.
For ASPM 77 airports (see footnote 7) aggregated, the FAA scored the overall weather impact as none or minor for all days month-to-date (through 3/23/22). In March 2019, two days were scored as moderate. Source: FAA ASPM Weather Factors module.
For any weather geeks among readers, mean CAPE per the SREF is 39 during late afternoon.
Cargo airlines as well as private jets are not included in scheduled demand and only become apparent when they file a flight plan (generally day-of). This unforeseen demand introduces the risk that delay probabilities/intensities are under-forecast. Unscheduled demand added 28.3% to scheduled demand for ASPM 77 airports (see footnote 7) month-to-date (through 3/23). For the MSP and ORD, unscheduled demand adds 13.4% and 7.4% respectively.
While our modeling is aimed at tackling arrival delays, there's a strong correlation to departure delays (albeit with some lag and/or possible alleviation). Consider a scheduled "turn" at an airport: the inbound flight is scheduled to arrive at 2:19 p.m. and departs at 3:30 p.m. (71 minutes of turnaround time). Let's say the inbound is delayed by 40 minutes and instead arrives at 2:59 p.m. We'll further assume that the airline doesn't need the full 71 scheduled minutes to turn the aircraft and can accomplish the turn in 45 minutes if they hustle - the departure will push back from the gate at 3:44 p.m. (delayed by 14 minutes). In this example, a 40 minute arrival delay in the 2 p.m. hour is partially passed through to a departure in the 3 p.m. hour. Had the turnaround been scheduled at 45 minutes instead (i.e. no turnaround buffer), the lag between arrival and departure delay would still exist, however the delay would be fully passed through.
Core 30: ATL, BOS, BWI, CLT, DCA, DEN, DFW, DTW, EWR, FLL, HNL, IAD, IAH, JFK, LAS, LAX, LGA, MCO, MDW, MEM, MIA, MSP, ORD, PHL, PHX, SAN, SEA, SFO, SLC, TPA
ASPM 77: Core 30 plus ABQ, ANC, AUS, BDL, BHM, BNA, BUF, BUR, CLE, CVG, DAL, DAY, GYY, HOU, HPN, IND, ISP, JAX, LGB, MCI, MHT, MKE, MSY, OAK, OGG, OMA, ONT, OXR, PBI, PDX, PIT, PSP, PVD, RDU, RFD, RSW, SAT, SDF, SJC, SJU, SMF, SNA, STL, SWF, TEB, TUS, VNY
We’re working on a sub-model to forecast unscheduled demand, however an ad-hoc forecast of PBI’s unscheduled demand tomorrow is beyond the scope of this post.


First, a shoutout for working “graupel” in! This might be the first time I’ve seen it in a newsletter. That & virga never get any love.
Very surprised to see PBI was in the program so many times. That makes sense with GA traffic, but I would’ve thought cargo carriers filed ahead of time.