It’s not a great sign that an FAA-telecom deal panned by the airlines’ trade association is a relative bright spot in the summer travel narrative. But absent the phased approach therein, which should allow for July 5—when previously agreed-upon mitigations were set to expire—to “look like any other day,” the sentiment might be abject panic. As is, just bleak seems to suffice.
Last week, the airline CEO’s were called in front of DOT Secretary Buttigieg to account for performance over Memorial Day weekend (when US airlines cancelled more than 2,600 flights). Airlines proceeded to cancel nearly 3,400 flights last weekend, including one very regrettable cancellation that snarled Buttigieg’s travel. Tough look.
The airlines have since requested another meeting with Buttigieg, in what feels like a tardy cross-examination of air traffic controller staffing. Pressed for details on how they’ll bolster reliability for the July 4th weekend and the remainder of the summer, leadership—both airline and FAA—will presumably posit that they’re better-positioned moving forward. 🤨
Resetting
Before we look ahead, let’s take a moment to contextualize airline performance over the past several weeks. Is it really as bad as it seems? According to data from FlightAware, US airlines cancelled 2.69% of their schedule from May 27 to June 22. For the same period in 2019 (based on weekday), US airlines cancelled 2.08% of flights. We think communicating percentage change of a number measured in percent is a bit misleading, especially when it’s a small percent (in this case it’s a 29% increase). Perhaps the best way we can frame it is as such: a traveler would have needed to take about 85 flights during the period before we’d expect they encounter an incremental cancellation in 2022 relative to 2019.
Mileage may vary by carrier, however, and Delta’s mainline deterioration is arguably most material. Their cancellation rate jumped to 3.29% from a microscopic 0.30% in 2019; a traveler would have needed “only” 17 mainline Delta flights before we’d bet they encounter an incremental cancellation. At the other end of the spectrum, Southwest succeeded in knocking down their cancellation rate to just below 1% (from 2.96% in 2019).
Of course, just because a traveler evades a cancellation doesn’t mean their itinerary is unscathed. Air traffic delays1 are actually less prevalent thus far than the first few weeks of 2019’s summer air travel season—EDCT incidence for Core 30 airports has been almost halved. Unfortunately, airlines have forfeited this head start. The percentage of flights that arrived more than 14 minutes late for any reason has increased 4.1 percentage points from 2019 to 22.4% of flights. In this respect, we’d bet a traveler experienced an incremental delay after “just” 13 flights relative to 2019. Delay intensity (i.e. average length of delay) is down narrowly to 53 minutes.
Capacity *checks notes* increases?
So with a better baseline, let’s consider what’s coming down the pike. Visibility into carrier-controllable delays (e.g. aircraft maintenance, baggage loading, etc.) is low, but we have a line on air traffic delays. In our summer air travel primer, we triangulated EDCT incidence, capacity and demand. For the sake of these posts, we combined capacity and demand into one variable (capacity utilization, i.e. demand as a percentage of capacity) to yield a simpler, two-dimensional problem. We were then able to demonstrate an exponential relationship exists between air traffic delays and capacity utilization wherein (1) an increase in capacity or (2) decrease in demand reduces capacity utilization which should, in turn, suppress air traffic delays.
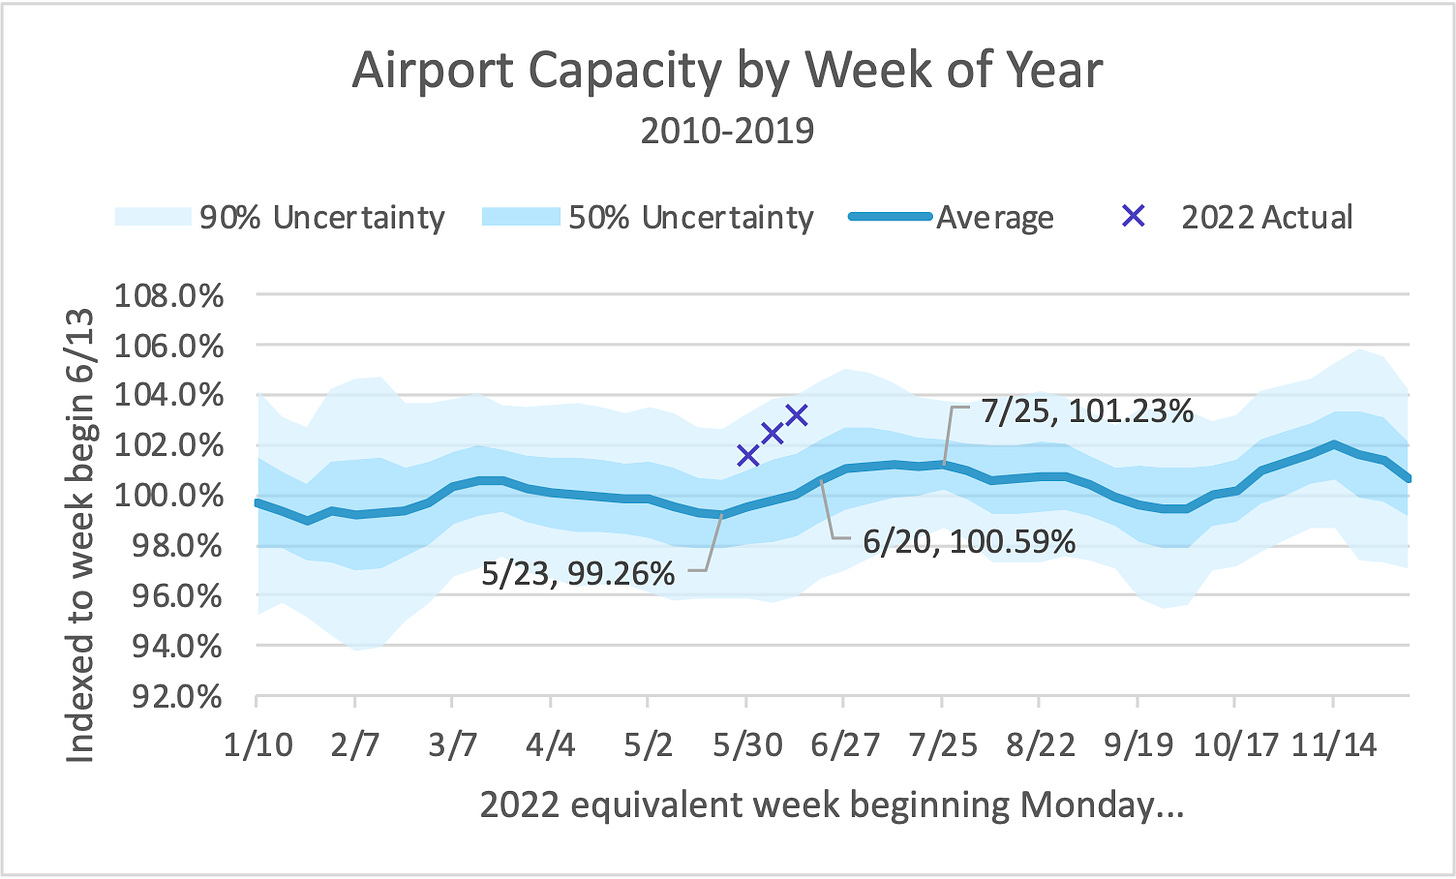
We’ll tackle capacity first, for which we examined Core 30 airports from 2010-20192. In the primer, we aggregated data by month; here we’ll aggregate by week to provide a little more granularity. To better capture the possible range of capacity, we counted the week itself as well as the week on either side when calculating average and standard deviation. Finally, because arrival rates summed across airports and days means little to most (ourselves included), we indexed to last week.
Admittedly, we were a bit surprised that capacity typically climbs through June, given that convection appears3 to peak in mid- to late-June. As best as we can surmise, the benefit of runway construction projects wrapping up ahead of “summer” outpaces the continued increase in thunderstorm activity. There’s also some non-convective tailwinds (the good kind) in places like San Francisco (SFO), where May winds are more likely to produce an unfavorable south configuration. But that brings us to an important point—though air travel may feel back to “normal” in many respects, capacity & demand dynamics are still off in spots.
Pre-COVID, rising capacity would have provided much needed relief for SFO, which was plenty prone to air traffic delay (behind only Newark for Core 30 airports during 2010-2019). SFO’s lagging demand recovery4 prompts a somewhat philosophical question, however. Consider it our “if a tree falls in the forest…” thought experiment. If there’s insufficient demand to produce delays, does an increase in capacity really matter? The punchline: There may be cases where previously-meaningful increases in capacity don’t [yet] deliver the same benefit as pre-pandemic, i.e. not all capacity is created equal.
On average, we’d expect Core 30 capacity to be on the increase this week as well as 4 of the next 5 weeks, peaking in late July. But like the cone of a hurricane forecast, it’s critical that we view capacity (and almost everything else) through the lens of uncertainty. To that end, capacity in each of the past 3 weeks has actually (sadly?) been above 2010-2019 averages—in the upper quartile, for that matter. So are the first three weeks of summer capacity predictive of capacity for the next dozen? We surprisingly found some evidence5 to suggest they are, which permits cautious optimism about capacity for the remainder of summer. Even so, we can’t help but feel like we’ll see some regression to the mean (EWR beat a very deep-seated sense of pessimism into Tim). For the moment, we’ll put a pin in that question and turn our attention to demand.
It’s summer, but we’re still layering
There’s comparatively more confidence in the demand side of the capacity utilization equation. It’s not without uncertainty—how will demand net out when private jets and cancellations6 are said and done? And how deep will the next round of cuts to selling schedules be?—but for the purposes of this ad-hoc analysis, what’s selling in the latest OAG snapshot will suffice. Like capacity, we’ll consider just arrivals to Core 30 airports (though for all hours, not just reportable hours).
Scheduled demand has been on the increase each of the last 4 weeks (this one included), which helps to explain some of the apparent deterioration. It’s set to briefly dip in the next two weeks, though is quick to bounce and eventually plateaus at levels slightly above this week’s. Mercifully, airlines have significantly reduced their planned summer schedules (to the tune of about 6%) over the last 3 months. While these schedule cuts have resulted in some painful itinerary changes, if that demand wasn’t pulled out of the system, we’d be sitting at a higher point along the exponential curve (read: more air traffic delays). And airlines aren’t done trimming yet: United received a waiver from the FAA to remove about 50 daily trips from their Newark (EWR) schedule, starting July 1. These EWR cuts are not reflected in the June 20 OAG snapshot, though represent at least another quarter point of demand reduction.
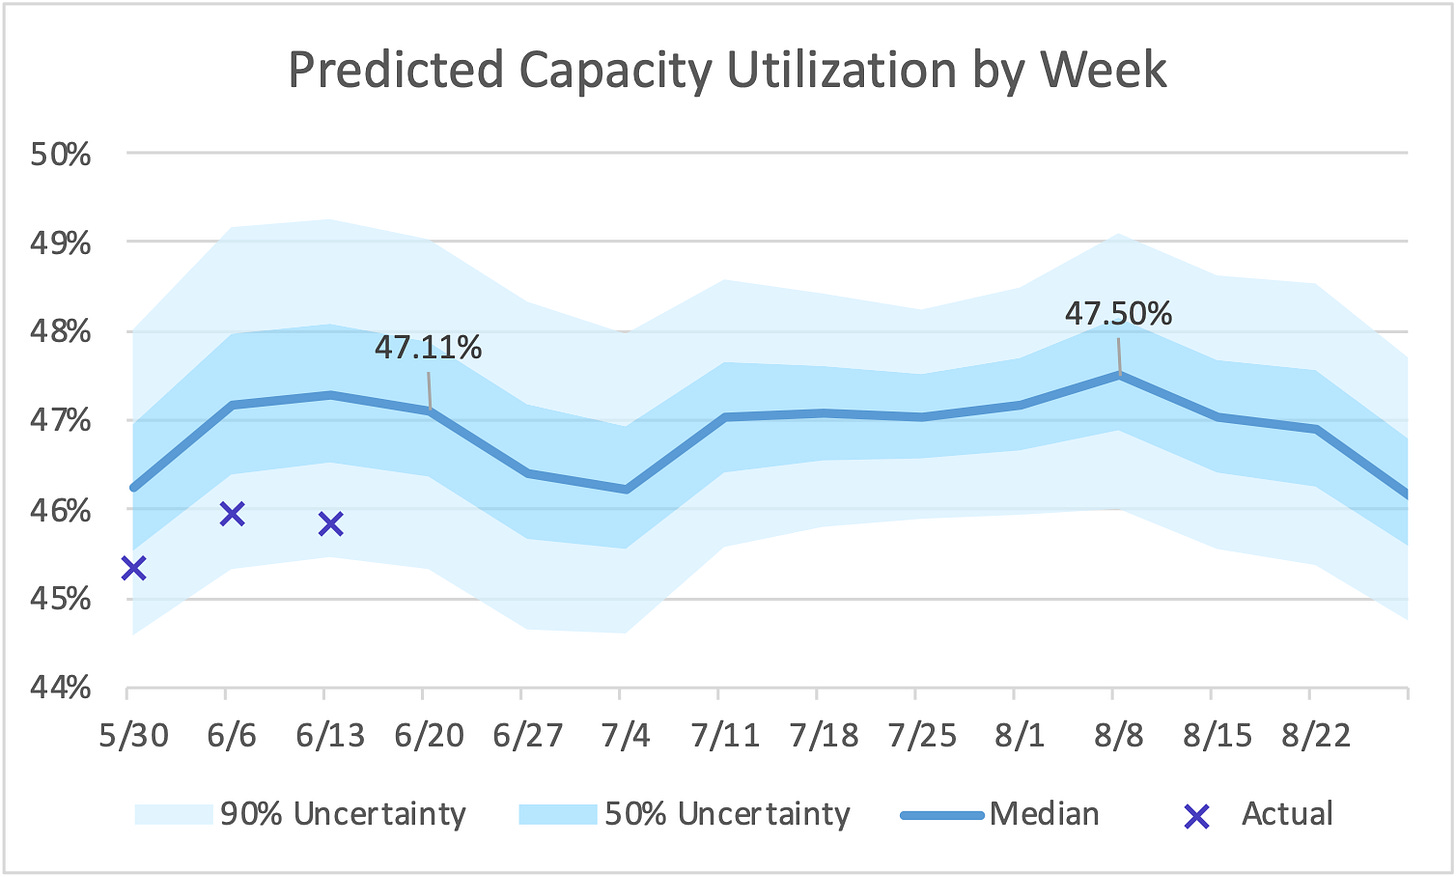
Alright—with an idea of what they look like separately, let’s layer demand on top of capacity. We’ve elected to stop short of predicting weekly EDCT incidence, as there’s a bit too much randomness at the shorter aggregation interval (i.e. weekly vs. monthly). The underlying uncertainty in capacity plus a model error would have produced prediction intervals in which it’d be a little too easy to get disoriented. That said, there’s still a perceptible exponential relationship and corresponding correlation (0.44 r-squared) at the weekly-level; we believe capacity utilization, even at the shorter aggregation interval, is useful in predicting at least the directionality of air traffic delays.
Because there’s an inverse relationship between capacity and its utilization (i.e. an increase in capacity results in decreased utilization), you’ll note that our actuals for the last 3 weeks have flipped to the lower quartile. Over the next couple weeks (July 4th included), we wouldn’t be surprised to see some amelioration in air traffic delays—a dip in selling schedules and capacity that continues to climb (on average) should work in unison to reduce utilization. And because air traffic delays ripple through an airline’s system, we’d also expect fewer EDCTs to bolster general reliability (e.g. fewer delays awaiting connecting crew, more ground time to board, baggage handlers able to proceed to their next assignment on-time).
But any respite will be short-lived we think. Demand is quick to bounce back during the second week of July, when capacity plateaus (on average!). Resultantly, much of July looks to sit at a utilization quite similar to where we are this week. Most concerning, however, is early August. Like the benevolent collaboration between capacity and demand during the next couple weeks, they’re set to move in tandem during early August—but in the wrong direction. Selling schedules peak (even when manually adjusting for EWR cuts) right around the same time something (start of hurricane season?) starts to drag on capacity. Any surge in EDCT incidence would conversely destabilize other facets of the operation. And there’s still regression to the mean to worry about!
We used the percentage of arrivals to Core 30 airports (see next footnote) assigned an estimated departure clearance time (EDCT) as our measure of air traffic delay incidence. EDCTs (often called wheels up times) marshal the queueing that results when demand for an airport’s runway(s) exceed their capacity. If you're curious about the conceptual underpinnings, we’d encourage you to check out our explainers.
Airport capacity as measured by efficiency AAR for 2018 reportable hours.
Core 30 airports are ATL, BOS, BWI, CLT, DCA, DEN, DFW, DTW, EWR, FLL, HNL, IAD, IAH, JFK, LAS, LAX, LGA, MCO, MDW, MEM, MIA, MSP, ORD, PHL, PHX, SAN, SEA, SFO, SLC, TPA.
We used winter solstice of the preceding year to identify week 1 and the week starts on Monday.
SFO’s June 2022 frequencies are 75.6% of June 2019, ranking them behind all but ORD, MSP, DTW and PHL among Core 30 airports.
We shoved a linear trendline through a scatter plot with 10 observations. Not the most rigorous bit of data science, we know. But the r-squared of 0.63 was tough to totally dismiss.
We think it reflects, in part, the effects of runway construction projects that stretch across the summer. There’s relatively little of that activity this summer, thanks to a couple airports that took advantage of depressed demand to accelerate/complete runway rehabilitations during last summer.
Private jets do not file schedules with the likes of OAG or Cirium, though create demand for runways all the same. Cancellations, conversely, avail runway slots.


