Welcome to any new readers — we're grateful that you're here! We're building deep learning algorithms to democratize flight delay predictions; until we launch, we're eager to synthesize things manually in our outlooks. These feature several recurring themes that we recognize may be unfamiliar or intimidating, so we’ve written explainers that tackle airport arrival rates, queuing delays in the airspace and different tools to distribute those delays. If there’s a topic or mechanism you’d like to see unpacked, please let us know (same goes for special travel occasions).
TSA checkpoint numbers fell to 1.98 million travelers yesterday, snapping a five-day streak with at least 2 million screened. It’s a bit difficult to tease apart the influence of Omicron from normal day-of-week demand patterns, but—as a percentage of capacity—passenger volumes have declined for four consecutive days. Demand is hardly cratering, but a bit of softening seems increasingly apparent. Add to that Delta’s CEO lobbying the CDC for shorter quarantine times to alleviate already-strained airline staffing (echoing our note in yesterday’s first look, we might add), and the sentiment is decidedly more downbeat in the last day. Nevertheless, while we wouldn’t be surprised with another 1 handle for travel today, we’d bet Thursday bounces back above the 2 million screened mark.
Yesterday’s first look helped us to narrow our focus as it relates to unsettled weather across the Western U.S. and we’ve returned today to more closely examine Las Vegas (LAS), Seattle (SEA), San Francisco (SFO) and Salt Lake City (SLC). This group will exert outsized leverage on how travelers fare on Thursday, with 15% of system seats scheduled to arrive or depart one of those airports. Though SFO poses the greatest risk to itineraries tomorrow, we’ll save it for last to ensure we have their latest TAF1.
This group will exert outsized leverage on how travelers fare on Thursday, with 15% of system seats scheduled to arrive or depart one of those airports.
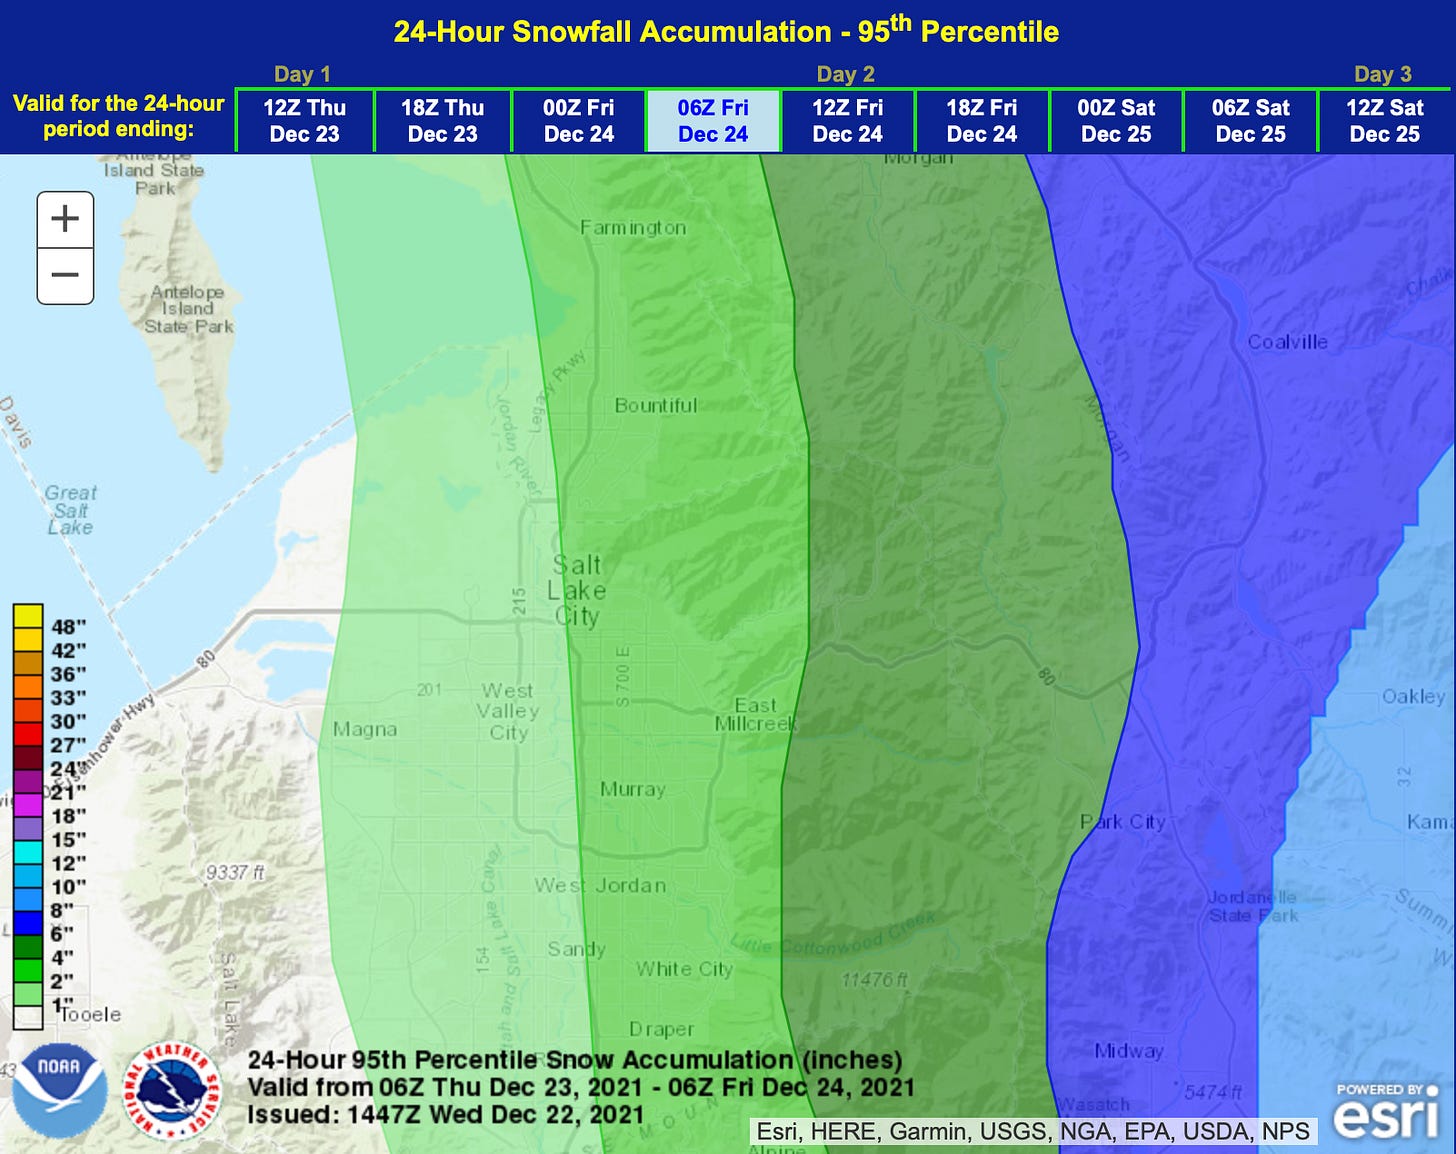
Instead, we’ll get started with Salt Lake City (SLC), which we should be able to knock out fairly quickly. Yesterday we were keeping an eye on one outlier model (the short-range ensemble forecast, or SREF) that called for increasing snow chances through the day. It’s since caved and agreement is better that a wintry mix should only occur at the onset of precipitation (as it encounters some pockets of cold air trapped in the valley) before a changeover to plain rain by early afternoon. Deicing delays for departures before 11:00 or so should be expected, but even 95th percentile snowfall accumulations would not warrant runway closures for snow removal. SLC’s arrival rate floor should be 60 on Thursday, which would comfortably accommodate the arrival peak of 36.
Seattle (SEA)
The SREF is a bit more stubborn when it comes to SEA, where it continues to introduce some slight chances for snow later in the day. Even if the SREF wins out in terms of precipitation type—and later departures require a quick spray to deice—accumulations shouldn’t amount to more than a coating and, like SLC, snow removal shouldn’t constrain airport capacity. Unlike SLC, the lower ceilings that accompany rain showers will likely be enough produce delays in SEA, at least mid to late morning. We maintain yesterday’s worse than 1 in 5 chance for airport capacity to accommodate the 48 arrivals scheduled for the 10 a.m hour. We’ve modeled a first-tier ground stop that assumes SEA delivers a 42 arrival rate: delays for captured flights (i.e. originating from within approximately 600 miles) average 31 minutes2 and linger into the 11 a.m. hour.
Beyond the 10 a.m. hour, we should also mention the 8 p.m. hour, when 42 flights are scheduled to arrive. Ceilings may lower to underneath 2,000’ later in the evening, which would further pressure airport capacity. We’d put chances around 1 in 10 for an arrival rate less than 42 by 8 p.m., though we bet miles-in-trail (MIT) is relied on to resolve this later demand overage. MIT spreads delay across more flights than a first tier ground stop (it’s also more difficult to track, unfortunately) and we predict delays would be almost imperceptible (average of 6 minutes, maximum of 15 minutes). There’s also some scheduled bunching early in the 10 p.m. hour that could produce a similar level of delay.
Las Vegas (LAS)
Forecasted ceilings for much of the day have been raised in LAS, which allows us to knock down our probabilities for reduced arrival rates. Ceilings look to stay at or above 6,000’ through early evening: we think there’s about a 1 in 10 chance for arrival rates less than 44 (and only 1 in 20 for lower than 36). Scheduled arrival demand peaks at 37 in the noon hour, which should be accommodated with only minor delay (average of 6 minutes) even at a 36 arrival rate. Ceilings are forecast to lower as the evening wears on, however, and LAS remains quite busy to finish out the day. Scheduled arrival demand is between 33-34 in the 9, 10 and 11 p.m. hours, when we’d put chances at nearly 1 in 3 for an arrival rate in the range of 28-32. If the FAA elects to manage the demand overage with MIT, we’ve modeled average delays under 10 minutes (and max delays under 20 minutes); if the FAA instead reaches for a first-tier ground stop, we’ve modeled average delays of about 30 minutes for captured flights. Whether MIT suffices or a GS is necessary probably depends on unscheduled demand…
As we referenced yesterday, LAS typically ranks above average in terms of private jet and cargo activity. For the FAA’s core 30 airports3, unscheduled demand added 10% to scheduled demand month-to-date; at LAS, this number was 15%. While LAS is typically busier than its peers in this space, we suspect Christmas may suppress some of this activity. Though it fell on Wednesday, the 23rd was also the busiest pre-Christmas travel day last year and unscheduled LAS arrivals were down 66% (relative to 12/1/20-12/22/20). Unfortunately, unscheduled demand is not apparent until they file a flight plan (generally day of), which complicates delay forecasting4. We’ll wait for the full demand picture to take shape tomorrow, but— on the balance—fewer unscheduled arrivals than normal nudges us towards the MIT scenario above.
San Francisco (SFO)
Despite our attempt to wait until the last minute, airport capacity at SFO tomorrow remains unclear. Confidence is high that they’ll be arriving Runway 19L at a 28 arrival rate to start the day and this configuration will last through at least the 9 a.m. hour, when 32 arrivals are scheduled. SFO exercises more creativity than most when setting the perimeter for their ground delay programs (GDP)—we’ve elected to model a GDP with a 1,200 mile scope, though it’s one more variable that increases uncertainty. That said, delays in such a scenario would average approximately 17 minutes for captured flights and linger into the 10 a.m. hour.
KSFO 222333Z 2300/2406 03006KT 1 1/2SM BR VCSH BKN003 OVC009       FM230500 13010KT 2SM -RA BR BKN003 OVC009
FM230600 17012KT 1 1/2SM RA BR OVC004
TEMPO 2307/2309 1SM +RA BR OVC003
FM231000 17014G21KT 2SM -RA BR OVC005
FM231400 17013KT 1SM -RA BR BKN005 OVC010
FM231900 23010KT 1 1/2SM -RA BR HZ FEW003 OVC008
FM240100 VRB05KT 4SM BR VCSH SCT005 BKN015
The bigger question is the noon hour, when 36 arrivals are scheduled. Winds are forecast to shift to a southwesterly direction by 11:00 a.m., which should allow for a more favorable runway configuration (61% chance that flights arrive Runways 28L, 28R and depart Runways 1L, 1R; 34% chance that arrivals and departures share the 28’s). Even if the airport is flowing in a more optimal direction, visibility looks to be poor enough to create delays. We think SFO will initially squeeze out 2 more arrivals per hour when landing on the 28’s, which would yield a 30 rate. Assuming the same 1,200 mile scope, delays for captured flights would average 37 minutes (and linger into the 1 p.m. hour). We think a 36 arrival rate is achievable by 5 p.m. if the TAF verifies, in which case delays would not exceed 10 minutes for the remainder of the day.
Recommendations
We're most concerned about any routings that include a morning or early afternoon connection in SFO, especially if the layover is planned at less than 60 minutes. We think it'd be prudent to at least explore rebooking options if this describes your itinerary. Though we suspect this describes fewer trips, we’d suggest the same if you’re originating in the Pacific Northwest and scheduled to connect in SEA around 11 a.m. The good news is airlines have materially improved rebooking flexibility by eliminating changes fees for most tickets (though a fare difference may still apply). We’ve linked to the same-day change policies for United (who operates a SFO hub) and Delta (who operates a SEA hub). One last thing—happy birthday, Mom!
We were excited to learn that Substack featured our blog on their homepage. It may sound cheesy, but it’s true — we wouldn’t have been selected if it weren’t for our readers, so thank you from the bottom of our hearts. We’ll be spotlighted for the remainder of this week, so if you’ve been thinking about sharing our blog with somebody, now could be an especially good time!
Terminal aerodrome forecast (TAF) is a format for reporting weather forecast information, particularly as it relates to aviation. TAFs are issued at least four times a day, every six hours, for major civil airfields: 0000, 0600, 1200 and 1800 UTC, and generally apply to a 24- or 30-hour period, and an area within approximately five statute miles from the center of an airport runway complex.
TAFs complement and use similar encoding to METAR reports. They are produced by a human forecaster based on the ground. TAFs can be more accurate than Numerical Weather Forecasts, since they take into account local, small-scale, geographic effects. Source: Wikipedia
While our modeling is aimed at tackling arrival delays, there's a strong correlation to departure delays (albeit with some lag and/or possible alleviation). Consider a scheduled "turn" at an airport: the inbound flight is scheduled to arrive at 2:19 p.m. and departs at 3:30 p.m. (71 minutes of turnaround time). Let's say the inbound is delayed by 40 minutes and instead arrives at 2:59 p.m. We'll further assume that the airline doesn't need the full 71 scheduled minutes to turn the aircraft and can accomplish the turn in 45 minutes if they hustle - the departure will push back from the gate at 3:44 p.m. (delayed by 14 minutes). In this example, a 40 minute arrival delay in the 2 p.m. hour is partially passed through to a departure in the 3 p.m. hour. Had the turnaround been scheduled at 45 minutes instead (i.e. no turnaround buffer), the lag between arrival and departure delay would still exist, however the delay would be fully passed through.
And of course, delays resulting from aircraft servicing, airline staffing, network effects, etc. are also always lurking (and not included in our modeling).
ATL, BOS, BWI, CLT, DCA, DEN, DFW, DTW, EWR, FLL, HNL, IAD, IAH, JFK, LAS, LAX, LGA, MCO, MDW, MEM, MIA, MSP, ORD, PHL, PHX, SAN, SEA, SFO, SLC, TPA
Unfortunately, it biases our model towards under-forecasting delays, as demand overages are potentially understated. We’re working on a sub-model to predict unscheduled demand.


Just found this newsletter. This is incredible. Really in-depth. I think it’ll take me some time to really start being able to take it all in, but I’m looking forward to it.