This post is more about Aerology, the idea behind it and our roadmap. There will be comparatively little analyses about what air travel will look like tomorrow (at least in the literal1 sense) or current-goings on in the industry. We wanted to give you a heads up at the top that there may be less utility in this one—no offense taken if you choose to skip it.
We kinda jumped right into things with this blog, huh? Explainers and disruption outlooks straightaway. We have our about page, but otherwise never really took a moment to elucidate what we’re building and why—as part of that—we’re writing.
Let’s start with the problem.
52.1 million disrupted air trips (that’s per year for US travelers)
It’s a pretty effective headline, we think. So what, exactly, do we mean by it?
It’s intended to reflect2 the number of airline passengers who (1) had their connection broken, (2) had their flight cancelled or (3) arrived more than 60 minutes late due to a one-segment delay. While fifty million feels a bit abstract (it’s on the order of 1 in 20 trips disrupted), let’s not forget that’s composed of a lot of misses. Missed time poolside. Missed rehearsal dinners. Missed interviews. Missed goodbyes.
At this point perhaps you’re nodding along at the acuteness of the problem but want to circle back to our use of 2019. Is it appropriate to make assumptions based on “normal” levels of air travel? And isn’t business travel changed forever? Bain, at least, thinks traffic will be fully recovered3 by second quarter of 2025: While we plan to launch an MVP later this year (more on that in a bit), our horizon is such that we’ll still be happily building then.
But recent booking data hints at a sooner return to normal—even for the business travel segment, which revisited 2019 levels for the first time in late March per Mastercard data. TripActions’ trajectory is especially encouraging. The travel and expense management startup surpassed its pre-COVID booking peak last fall, suggesting that tech-forward, user-oriented companies are well-positioned to capture travelers coming out of the pandemic.


While saving trips gets us out of bed in the morning (and keeps us up at night), we also recognize there must be some economic underpinnings. Fortunately for the prospects of our company, the problem does not lack in size when measured in dollars. The FAA estimates air travel disruption cost four U.S. parties a combined $33 billion in 2019:
passengers ($18.1 billion), who lost time as a result of a disruption or made voluntary but disfavored adjustments in anticipation of delay;
airlines ($8.3 billion), that incur additional direct operating expenses (e.g. paying crews beyond scheduled block time) and indirect costs from increased schedule buffer;
transportation mode switchers and trip foregoers ($2.4 billion), especially when the switched-to mode is car (with attendant road congestion and accidents);
and broader economy participants ($4.2 billion), by way of higher costs of doing business (owing to higher fares) as well as lost employee productivity.
We have a few ideas on how to monetize the problem, though we’re not quite ready to reveal that insight!
Zero to One
Alright. There’s definitely a [painful, expensive] problem.
So our solution is… to start writing a blog? Insofar as it’s an opportunity to do something that doesn’t scale—yes. That approach may not sound very startup-y, but it’s one of the most common pieces of advice doled out by a preeminent startup accelerator, Y Combinator. While our technical co-founder, Yamaç (more, too, on him in a bit 🎉) is writing our software’s code, Tim is the software. In this way, our disruptions outlooks represent a pre-alpha launch of sorts: Manually synthesizing weather forecasts, airport capacities and flight schedules allows us to get in front of potential users as soon as possible. To that end, we’d love to hear from you! Is there something we can do differently with these outlooks? Or is there an event you think warrants our attention (we’re even happy to offer some insight to individual trips)? We’re also really appreciative of anybody who shares our writing, as it grows the number of potential users we can talk with.
If Tim is uniquely suited to write these outlooks (having lead station operations for United at perma-disrupted Newark), Yamaç is exactly who we need to automate a scientifically rigorous solution. The national airspace system is a highly dependent network where time is shaved, wasted and reallocated—the perfect space for a machine learning researcher whose expertise is temporal methodological problems and sequential modeling. And thankfully the inverse is just true enough. Tim knows enough data science to participate in exploratory data analysis and feature selection; a master’s degree in economics, meanwhile, conferred a deep appreciation of interpretability upon Yamaç. Were it not for this bit of redundancy, the languages of our domains would be too different to faithfully reproduce air travel outcomes (and is what inhibits an airline from developing these tools internally) .
For the moment, we’re heads down on building a model informed by billions of data points4 and whose output is airport capacities. Not only is it really exciting to create something new, but we believe there’s a quantum of utility in probabilistic airport capacity predictions—so we intend to make them our MVP (keep an eye out for a beta signup in a few weeks).
That said, we also realize providing arrival rate forecasts doesn’t solve the problem.
Deli cheese
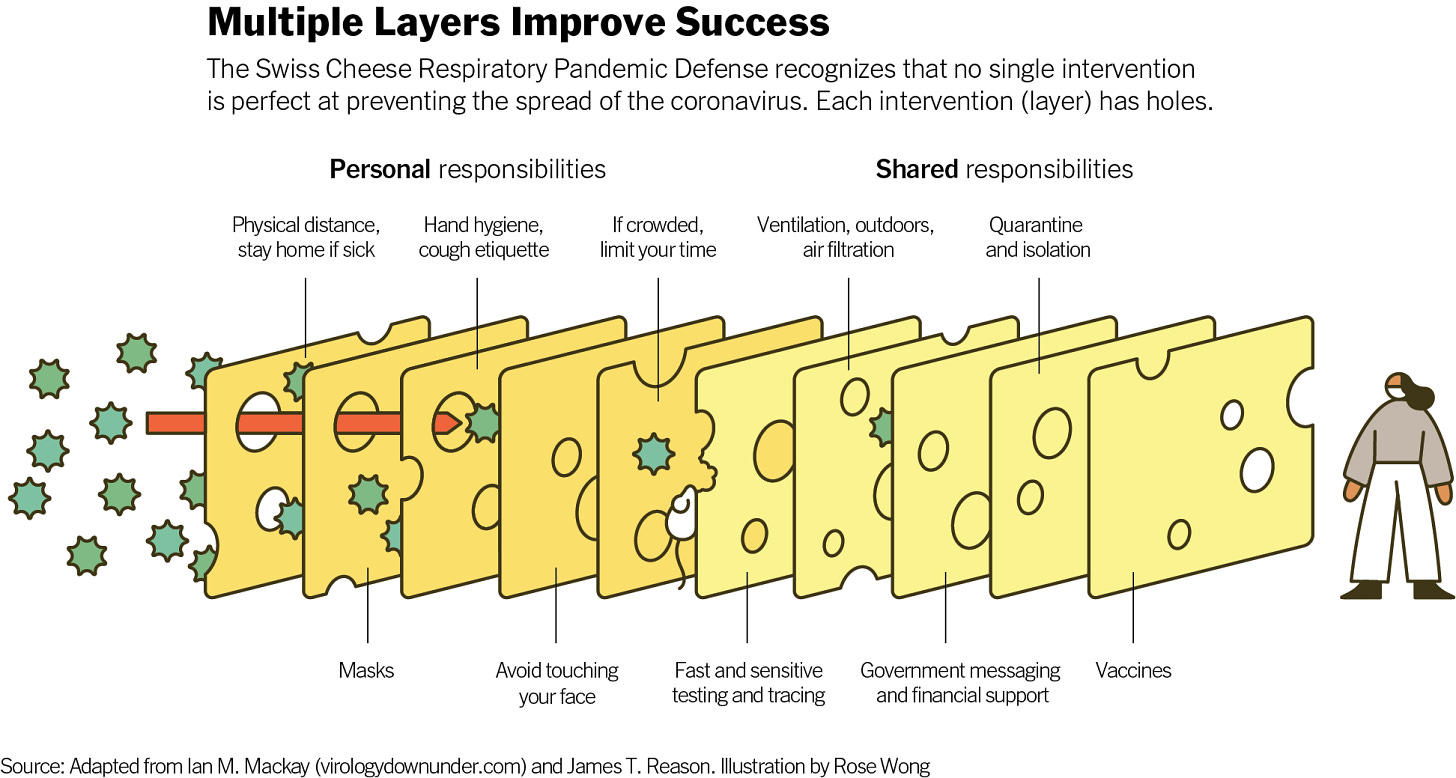
We envision a world where travelers are nudged to select more reliable original itineraries, airlines optimally distribute delay and trips that still stand to be disrupted by optimally-distributed delay are proactively rebooked. Like the Swiss Cheese model oft-referenced in the fight against COVID, each layer (original booking, operations optimization, proactive rebooking) successively filters out disrupted trips.
We’ve deferred an original-point-of-booking intervention to somewhere down the product roadmap (so for now we’ll implore you to never book an afternoon or evening connection in Newark less than 55 minutes). While it may seem counterintuitive to not prioritize a layer of defense at the outset of the journey, there’s relatively few strands of hair on fire early in the booking curve. Fast-forward to the day-of (or -before) travel, however, and it seems like both travelers and operators have conditioned their hair with gasoline. Airline and air traffic operations reliably provide the spark (metaphorically!), yielding a much more desperate (read: receptive) user at the end-of-journey. We’re confident we can quickly iterate to a serviceable—then optimal—suppressant.
Moreover, any close-in intervention (i.e. operations optimization or proactive rebooking) is underpinned by the same thing: real-time airport capacity predictions. This shared foundation affords some flexibility insofar as we can explore the fitness of our MVP for operators and frequent fliers before deciding which layer to tackle first. Not coincidentally, chaos (in the theoretical5 sense) renders the mental model of either persona inadequate. Though the breadth varies (for an airline manager, an entire flight schedule; for a traveler, their itinerary), it’s unrealistic to expect either to meaningfully anticipate how a day might unfold. In the absence of this foresight, operators and travelers are forced into a reactive posture.
So, for starters, we need to build on our airport capacity predictions—eventually arriving at flight-level predictions—to enable a more proactive posture. With a fuller option set, an operator might not let all that inventory get airborne; and a traveler can rebook before the best alternate routing departs. But predictions by themselves don’t fully solve either’s problem. We’ll have managed to turn on a firehose of predictions for operators, but with thousands of outcomes for which they’re responsible, they seem more likely to be bucked by it than to wield it precisely. We’d bet various tools would span the augment-replace spectrum, but schedule reductions, slot assignments, departure times, gate assignments and staffing all call for optimization. As a bonus, distributing delays in the way that is most cost-effective for airlines aligns nicely with the most environmentally sustainable way (i.e. shifting delay away from taxi and, especially, airborne phases of flight—when engines are running and crew are more likely to be paid—to on the gate).
The traveler, on the other hand, doesn’t figure to be overwhelmed by the volume of predictions (provided we design the product correctly), but there is the matter of cost to rebook. Being advised that you have a high probability of misconnecting is not particularly helpful if the fare difference for the best alternative is prohibitive. Something like an itinerary-specific waiver is needed to unlock the full slate of options.
Packy McCormick’s Founder’s Letter series that inspired this post typically closes with a call-to-action vis-à-vis the company’s career page. But we’re currently pretttyy lean (both in terms of our team and website). Our inbox/DM’s are always open, but that doesn’t convey quite the same polish.
So we might not have nailed the ending of Packy’s script.
We think we hit on the other key points, however. Most importantly, we hope you understand why Aerology is building; and while we need to keep some details related to “how” close to the vest, we hope it’s piqued your interest. If we succeed, we’ll have helped real people with real problems. That means a world with more chapters read on the beach, fuller wedding toasts, aced interviews and more time bedside.
… and if some of the story wasn’t clear, then we’ve found our call to action—tell us we need to work on our storytelling!
We started with an FAA-sponsored study that attempted to size disruption in 2007 and we extrapolated to 2019. Though a related paper offered some limited reproducibility via regression modeling, we elected to use Air Travel Consumer Reports as a proxy to estimate missed connection and cancellation rates. By our estimate (and theirs), disruption of these types grew by 4.1% between 2007 and 2019. This seems reasonable—if conservative—given a 26% increase in passengers against a 5.4 percentage point increase in on-time gate arrivals over the same period.
Our one-segment delay estimates were derived from MIDT direct passenger volumes. These are particularly prone to understatement, given cases where a connecting passenger completes their scheduled layover but still arrives late due to a delayed terminating flight.
That’s for global air traffic; North American intraregional traffic is projected to reach 100% of 2019 level by October 2024.
We have millions of observations, but hourly forecast initializations act as a multiplier. Yamaç has not quite transitioned from conference paper to marketing copy mode.
An excellent rabbit hole.


