Fall 2022 Air Travel Primer
And did traveler volumes over Labor Day Weekend really surpass 2019 levels?
Mercifully, summer air travel went gently into the good night this year—at least compared to its inauguration, when disruption raged1 across customer service queues. For the week-ended Labor Day, US carriers cancelled 1.09% of flights according to data from FlightAware; in the seven days starting the Friday of Memorial Day Weekend, airlines cancelled 3.15% of flights.
Of course, some absoluteness is appropriate. Did things go from bad to good or bad to… still pretty bad? For some context, US airlines completed 98.24% of their schedule in Summer 2019. Fast forward three years, and the industry completion rate was worse by 36 basis points. That’s on the back of nearly 2,900 more cancellations in 2022 (and a smaller denominator). A lot of messed up trips, no doubt; most of which contain individual stories of frustration that averages can mask. But the numbers are just too tempting to us: on average, a traveler would have likely encountered an incremental cancellation in Summer 2022 vs. 2019 only after 140 flights.
Speaking of numbers and people, the TSA screened more travelers over Labor Day weekend this year than 2019—the first time holiday weekend volumes returned to pre-pandemic levels. Checkpoint volumes from Friday to Monday last weekend reached 8.761 million, 145,000 more than the same period in 2019 per a TSA press release. Who are we—a blog—to disagree with the source of truth? We do wonder, however, if the TSA might have gotten tripped up by their own day-of-week mapping. Over the four days in 2019 mapped to 8/26-8/29/22 (Friday-Monday), TSA screened 8.779 million travelers (including a telltale 24% week-over-week drop on Sunday). That looks more like Labor Day weekend to us. And would mean TSA screened 18,000 fewer travelers during Labor Day weekend than 2019.
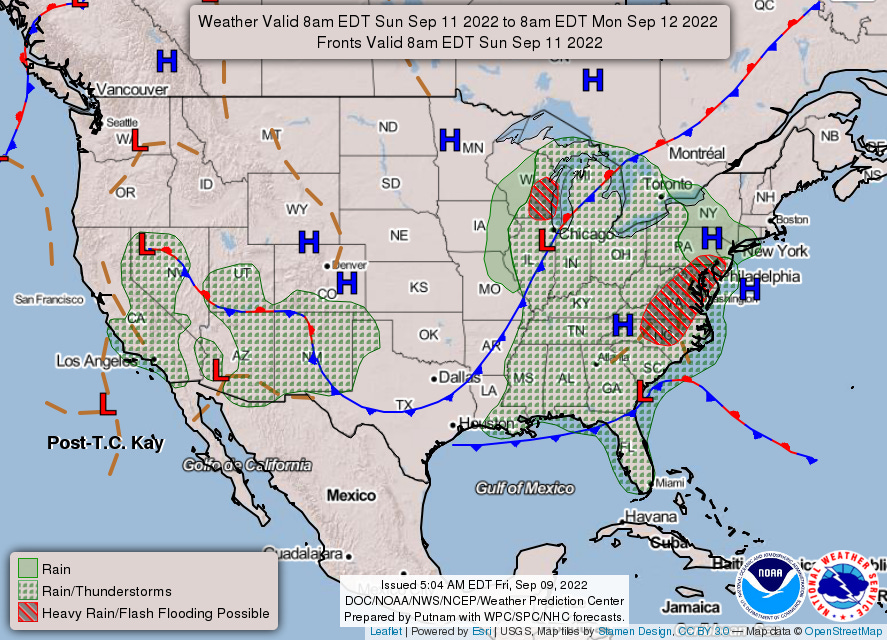
We’re publishing this fall preview in place of a two-day look ahead. At a glance, a demand overage is more likely than not for JFK and ATL tomorrow; then NYC and DCA on Sunday2.
American Airlines COO David Seymour lends some to support to TSA’s accounting, however, having shared that the airline flew 2.1 million customers over the weekend, “slightly more than we saw in 2019.” We doubt they would have also gotten lost in a day-of-week mapping exercise. For their part, Delta comes in closer to our view, having carried 300,000 fewer customers than 2019. Regardless, any return to pre-pandemic levels could prove fleeting. If last year is any indication, the 7-day moving average of TSA throughput—already 8.2% off of its Jul. 1 peak—will tumble another 9.2% over the next week.
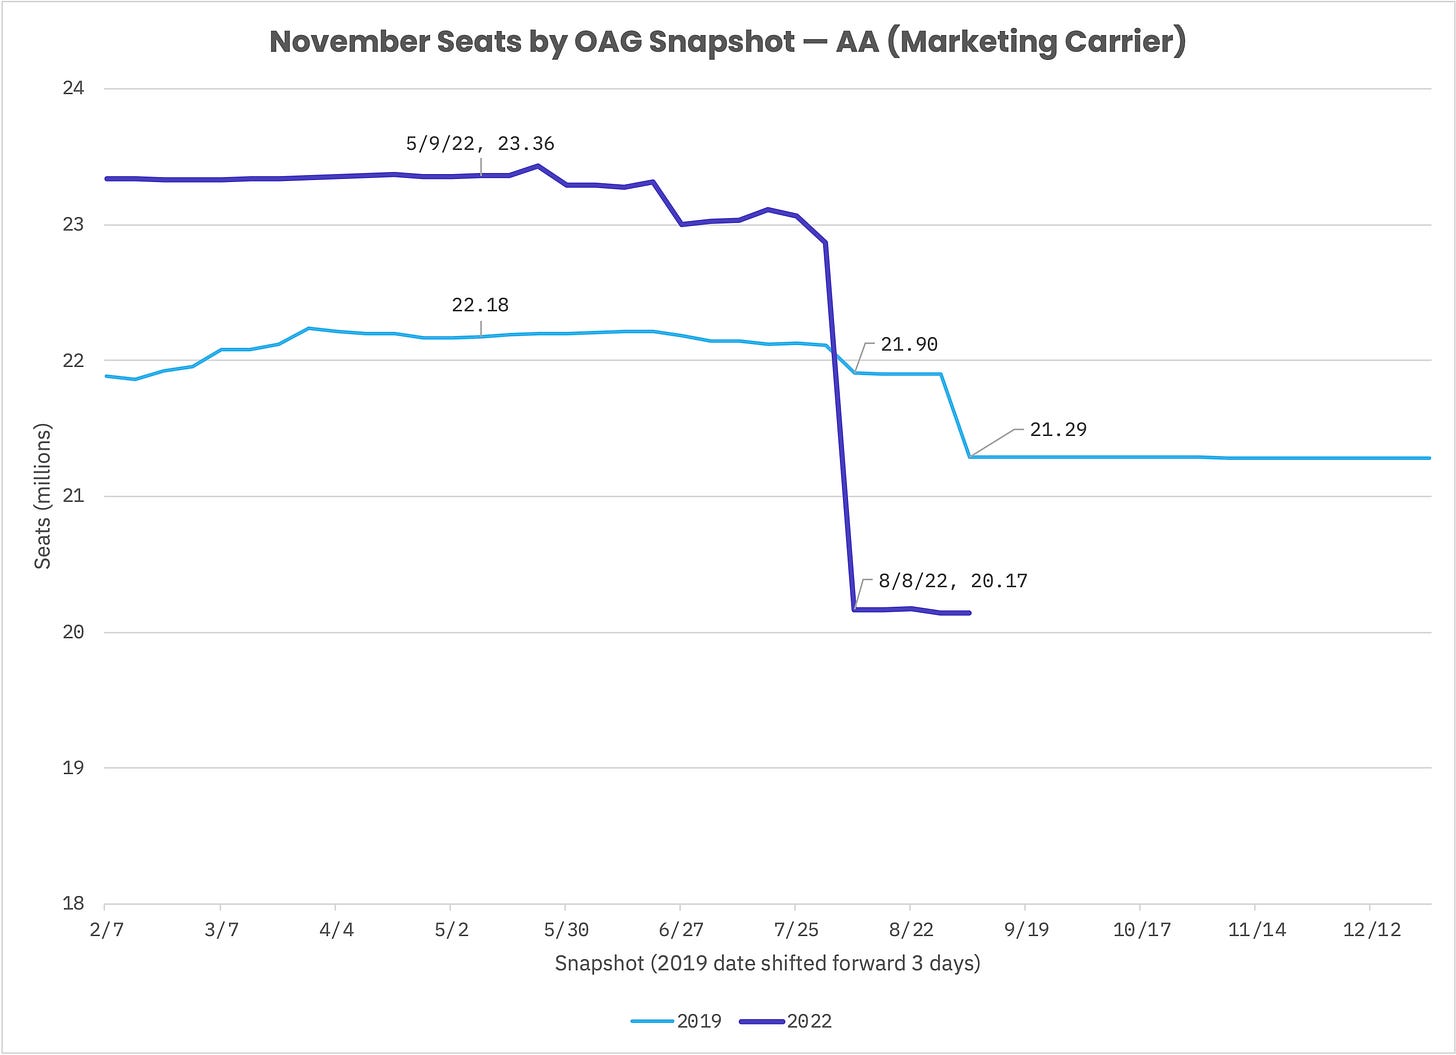
Discourse around fall air travel kicked off a few weeks before Labor Day, when American Airlines loaded a smaller November schedule. Coverage of this was a bit alarmist in our opinion—maintaining a parallel selling schedule that’s periodically updated as the planning schedule matriculates through Network is a pretty fundamental practice. That said, the November capacity reduction from American’s August 5 load was outsized relative to pre-COVID. By August 8, November 2022 seats were down 14% versus what was selling 3 months prior (including an 11.8% reduction owing to that single load). In 2019, November seats were trimmed by 1.2% over the same period (though would take one more leg lower in early September to settle at 4.0% down from what was selling in May).
Point being, selling schedules—and the demand it eventually represent on the national airspace system—remain more fluid than pre-COVID (even if traveler volumes are flirting with being fully recovered). So we reserve the right to revise the below forecasts. But we probably need to take a step back. What forecasts? And how did we arrive at them?
We’re interested in predicting air traffic delays and use EDCT incidence at Core 30 airports3 as our dependent variable. We hypothesize air traffic delays are a function of capacity and demand; to simplify the problem, we can consider demand as a percentage of capacity (i.e. capacity utilization). Then we throw a scatter plot together, shove a trendline through it and call it a model (and somewhere, a data scientist twitches). Importantly, the resulting relationship is exponential—there’s a compounding effect such that air traffic delays climb more rapidly as capacity utilization increases (like compounding interest, but bad). You can read more about the methodology in our Summer Air Travel Primer.

While we reluctantly accept fluid selling schedules4 as the numerator of capacity utilization, we can better capture the uncertainty in capacity—its denominator. We think the 10 years leading up to COVID provide a serviceable sample from which we can calculate average monthly5 capacities and their standard deviations. With descriptive statistics in hand, we can then derive monthly capacity percentiles and send each percentile through our exponential equation. This produces a range of possible EDCT outcomes.
While regression to the mean might have something to say about actuals, we were a bit surprised to see the distribution inch up in September and October relative to August. With demand relaxing a bit, we look to capacity for an answer—which does, in fact, tick down (on average!) by 0.7% and 0.9% in September and October, respectively, versus August. While convective activity abates headed into the fall, we chalk up this deterioration to a combination of construction (trying to sneak some work in after the peak travel season but before the snow starts to fall/ground freezes) as well as hurricane season.
The tropics look to remain quiet6, but runway construction might characteristically drag on capacity: one of EWR's two primary runways will be closed from Sep. 24-29, JFK's 4L-22R will be closed for 96 hours sometime in Septerber or October, DFW's 13R-31L is slated to close Sep. 20-Nov. 4 and work begins on LAS' 1-19 complex on Oct. 31. At least DEN's 16R-34L is set to return Oct. 3. If September and October feature middling capacity, at least November—when average capacity is at its highest—should deliver quite favorable dynamics (perhaps excepting peaking of flight schedules around Thanksgiving).
That felt a little forced. Apologies to Welsh poet Dylan Thomas.
EDCTs (estimated departure clearance time; often called a wheels up time) marshal the queueing that results when demand for an airport’s runway(s) exceed their capacity. If you're curious about the conceptual underpinnings, we’d encourage you to check out our explainers.
FAA Core 30 airports are ATL, BOS, BWI, CLT, DCA, DEN, DFW, DTW, EWR, FLL, HNL, IAD, IAH, JFK, LAS, LAX, LGA, MCO, MDW, MEM, MIA, MSP, ORD, PHL, PHX, SAN, SEA, SFO, SLC, TPA.
We also tack on an estimate of unscheduled demand comprised of the cargo flights and private jets that do not file schedules with the like of OAG.
We also examined capacities at a weekly level in our When do things start to get better post.
The National Hurricane Center’s 5-day outlook includes nothing of note; beyond that, the European Centre for Medium-Range Weather Forecasts (ECMWF) includes some low probabilities for activity across Florida during the week starting Sep. 19 and along the eastern seaboard the week starting Sep. 26 (pictured).


I'm just ready for the pendulum to come back to rest in the middle. It won't be news to anyone here, but I've see more "no crew available" cancelations or creative reroutes this summer than ever before. I know that won't change overnight, but with fall typically being slower, I'm hoping it gives everyone a chance to catch our breath.
P.S. It might've been a stretch, but kudos for working Dylan Thomas into airline operations.